Section 1
Contribution by Employment Level
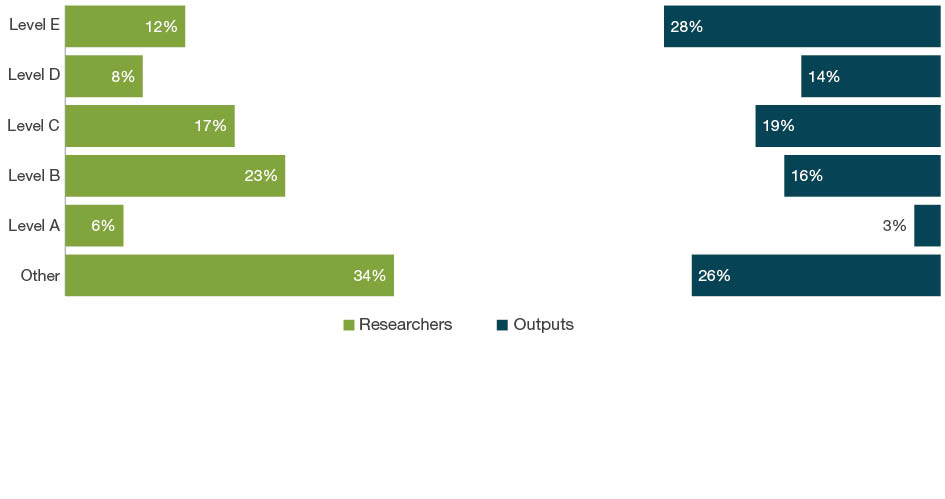
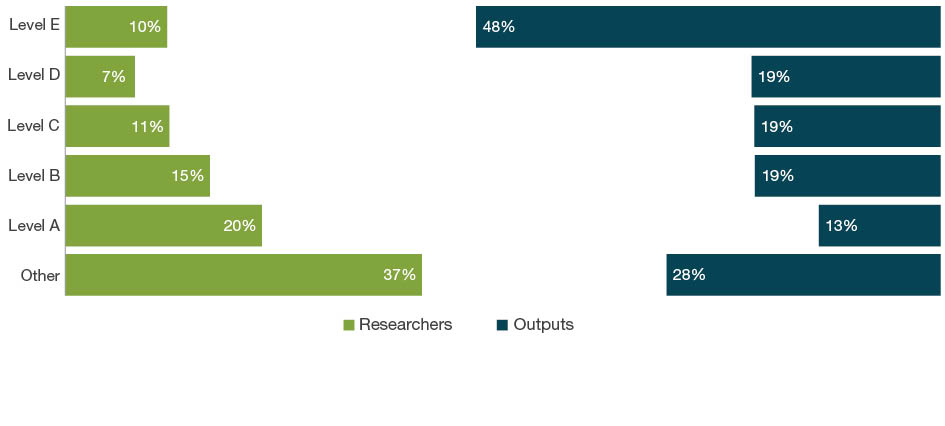
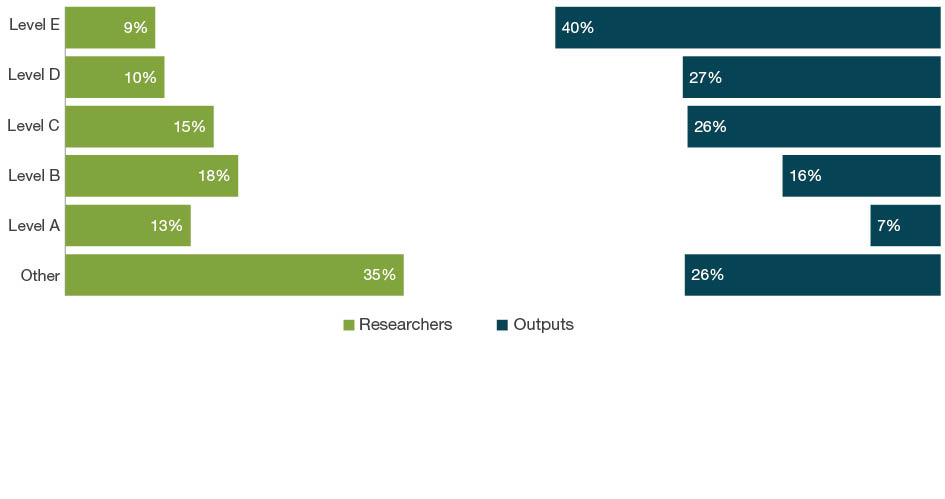
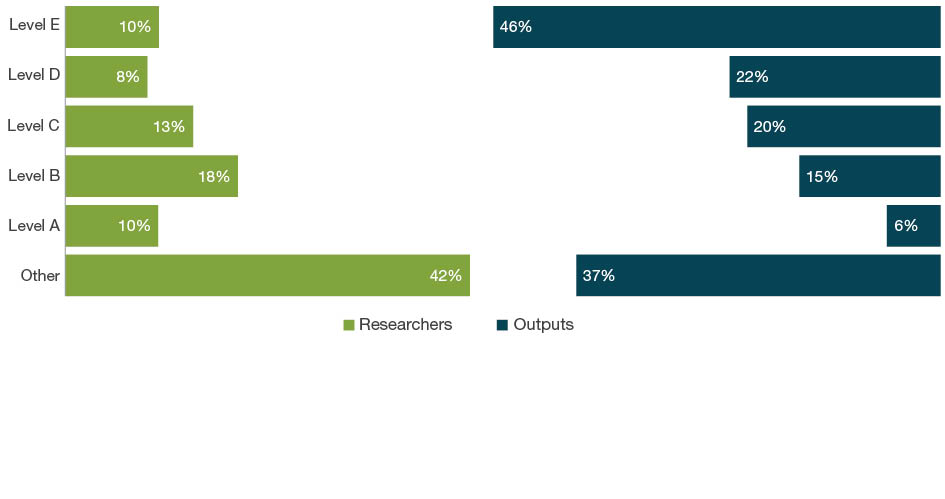
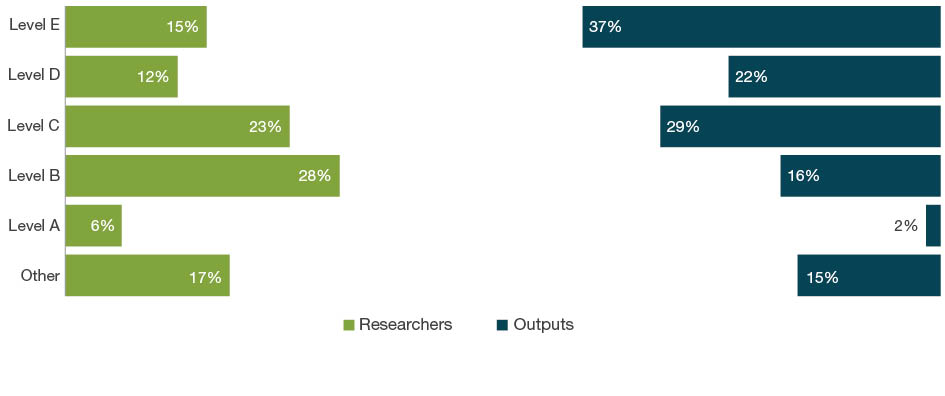
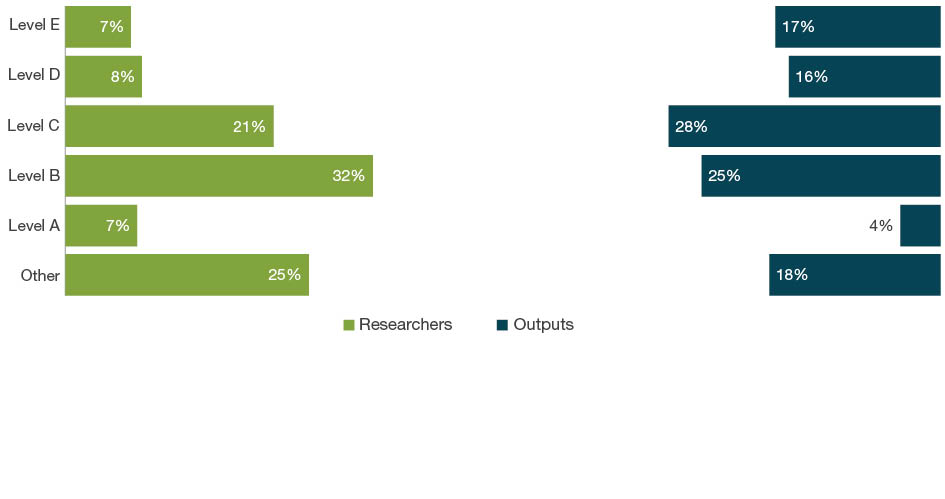
The following charts show how researchers at each employment level contribute as authors to output volume. There is a chart for the ERA 2015 data collection overall, and one for each two-digit FoR. The left hand side of each chart shows the distribution of eligible researchers across the academic levels A to E and the ‘Other’ employment level. Researcher numbers are measured on a headcount basis (that is, no apportioning for part-time hours). Employment status is not considered here. For example, an eligible researcher identified by their institution as Level E is counted equally whether they are an FTE employee (‘Employed’), a ‘Casual’ employee, or an ‘Other Appointment’ (for example visting or exchange). Note: due to rounding percentages may not sum to 100 per cent.
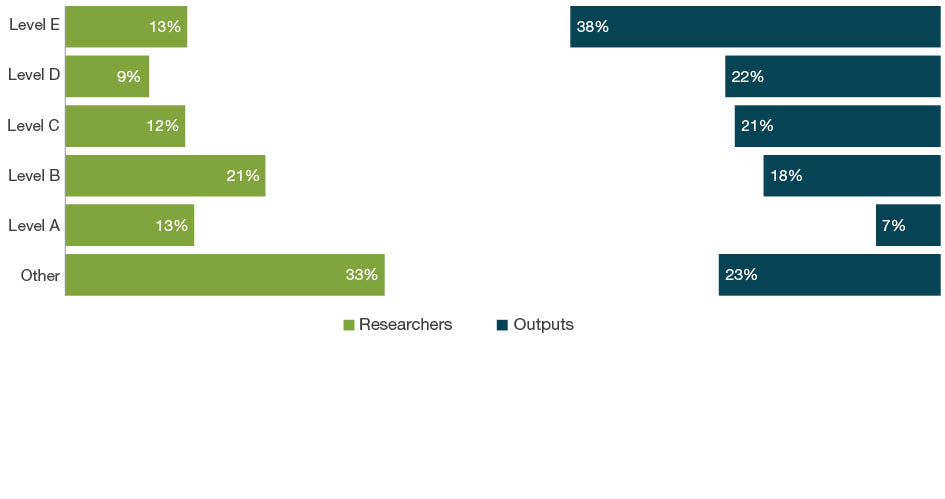
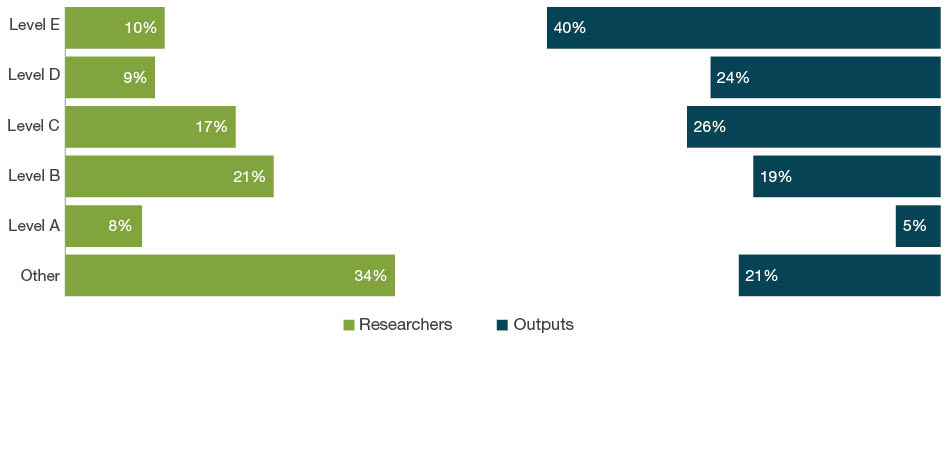
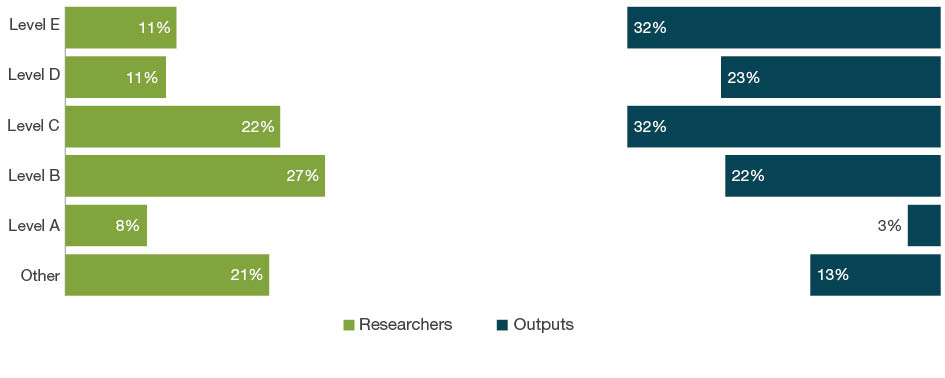
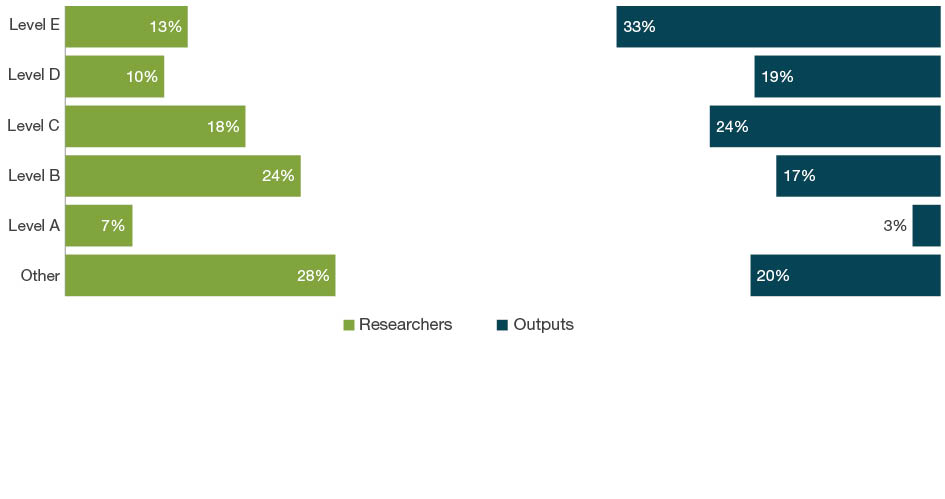
The right hand side shows the proportion of outputs where one or more eligible authors are at the corresponding academic level. An output is counted at a particular level if one or more of its ERA-eligible institution authors is at that level (authors who are not eligible ERA researchers are not considered here). For example, the second chart – for FoR 01 Mathematical Sciences – shows that Level C staff made up 15 per cent of all eligible 01 researchers and contributed as authors on 19 per cent of submitted 01 outputs. This means 19 per cent of all 01 outputs had one or more Level C authors. Note: since outputs may be counted more than once where there are multiple authors with different employment levels on each output, percentages will sum to >100 per cent.
All FoRs – Distribution of researchers and outputs by employment level
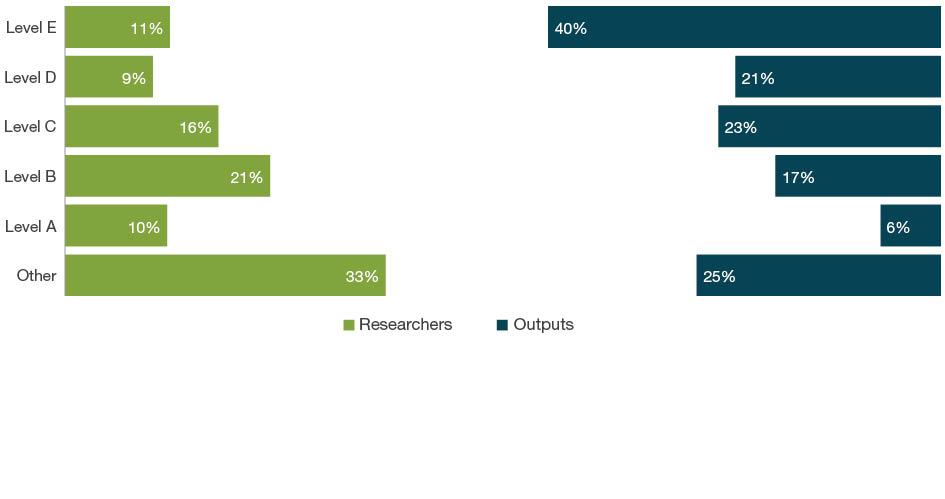
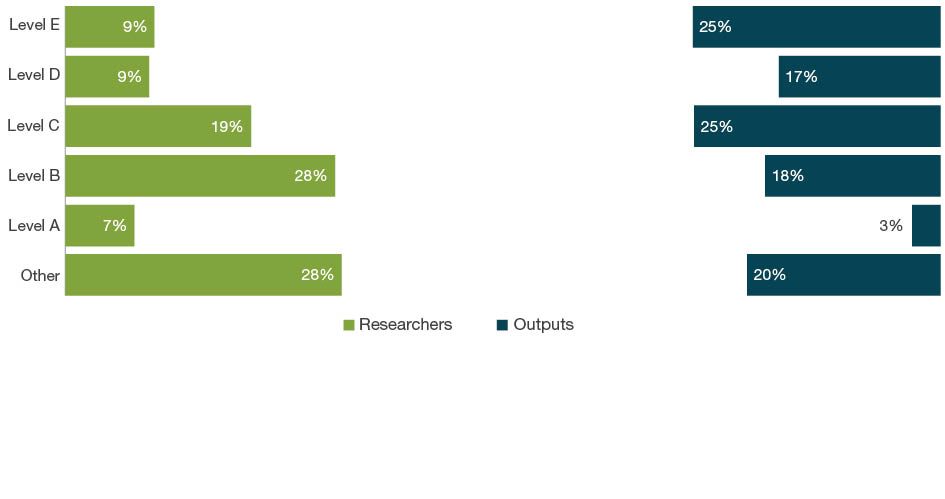
01 Mathematical Sciences – Distribution of researchers and outputs by employment level
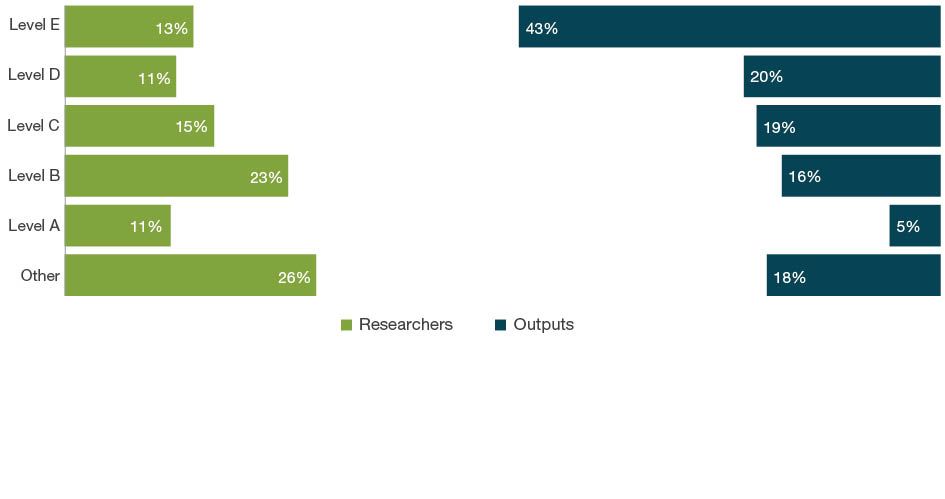
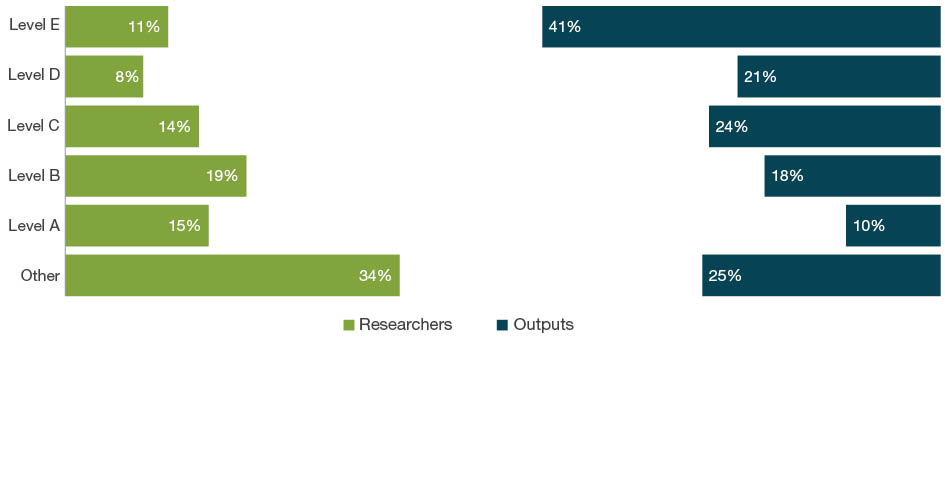
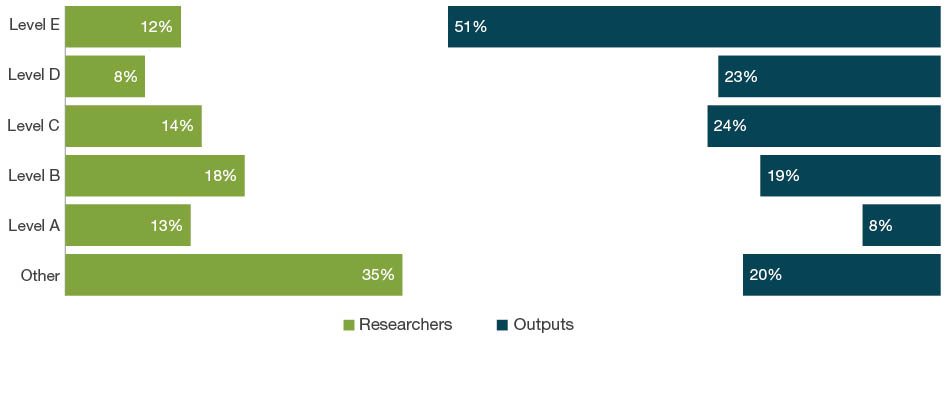
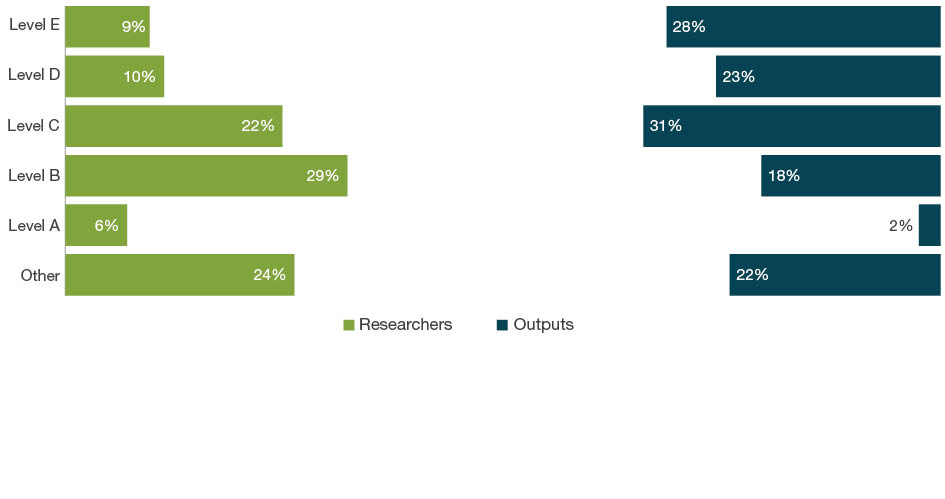
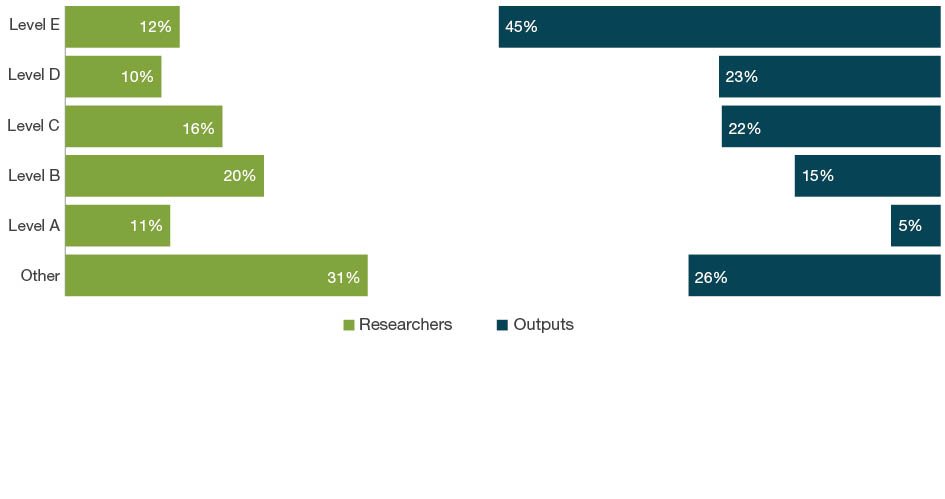
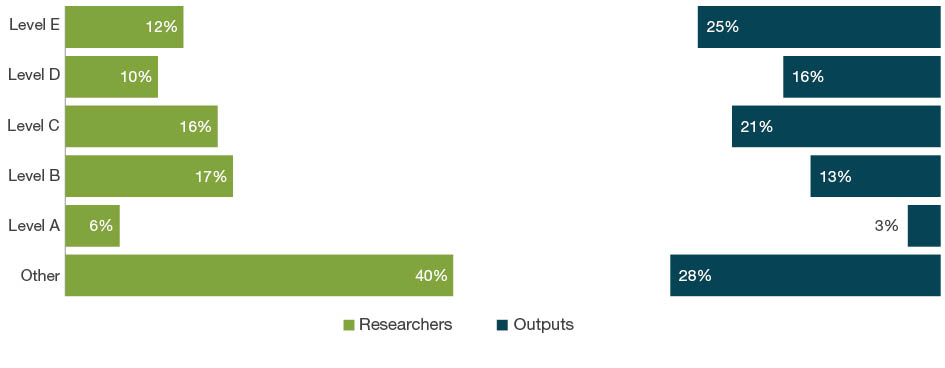
02 Physical Sciences – Distribution of researchers and outputs by employment level
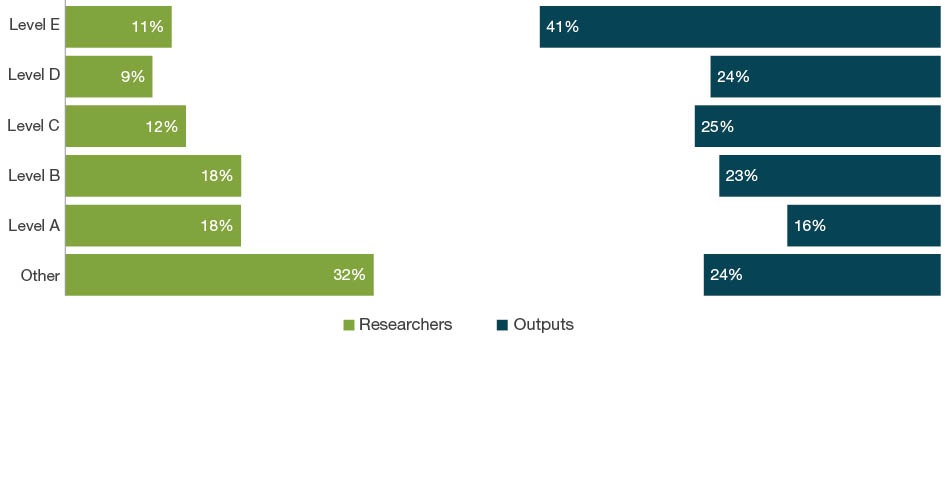
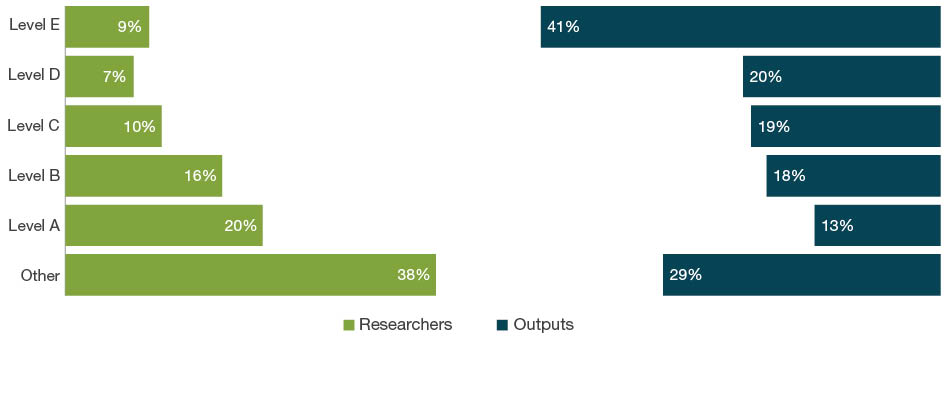
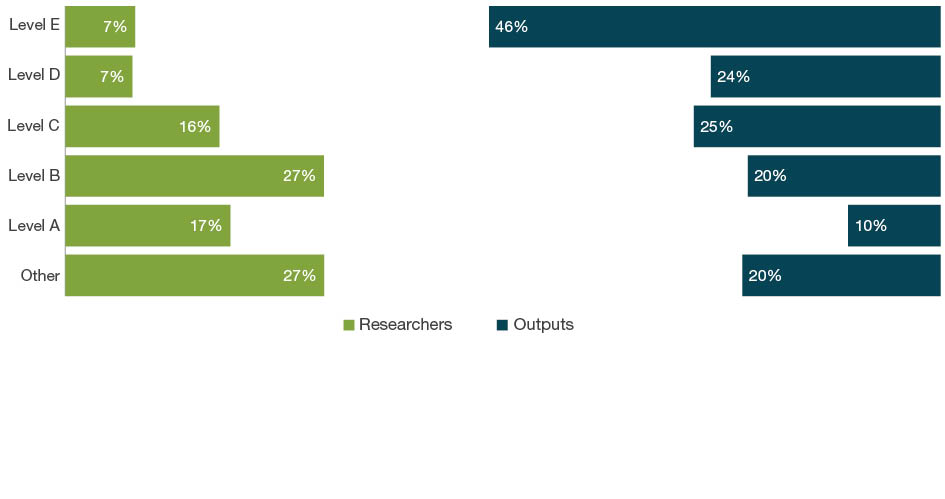
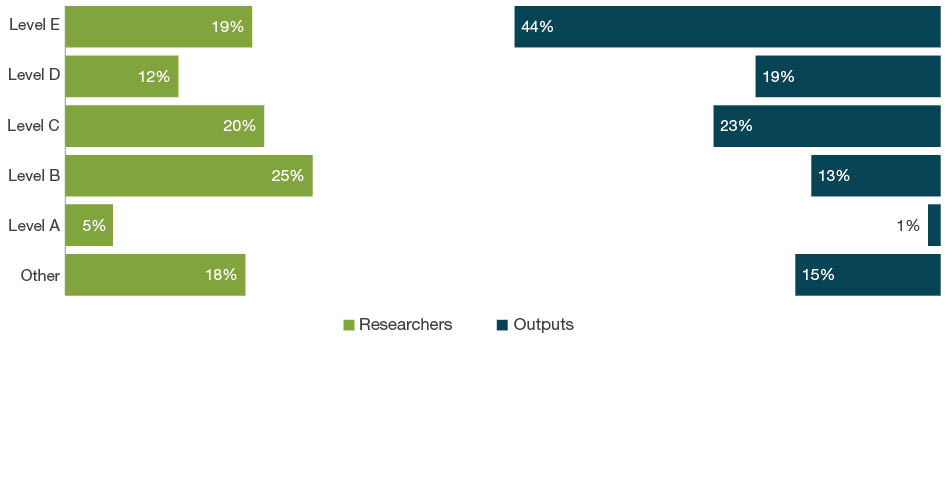
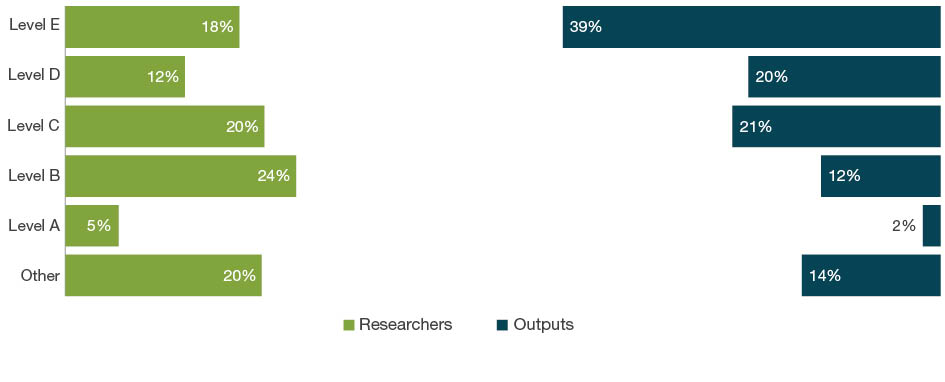
03 Chemical Sciences – Distribution of researchers and outputs by employment level
04 Earth Sciences – Distribution of researchers and outputs by employment level
05 Environmental Sciences – Distribution of researchers and outputs by employment level
06 Biological Sciences – Distribution of researchers and outputs by employment level
07 Agricultural and Veterinary Sciences – Distribution of researchers and outputs by employment level
08 Information and Computing Sciences – Distribution of researchers and outputs by employment level
09 Engineering – Distribution of researchers and outputs by employment level
10 Technology – Distribution of researchers and outputs by employment level
11 Medical and Health Sciences – Distribution of researchers and outputs by employment level
12 Built Environment and Design – Distribution of researchers and outputs by employment level
13 Education – Distribution of researchers and outputs by employment level
14 Economics –Distribution of researchers and outputs by employment level
15 Commerce, Management, Tourism and Services – Distribution of researchers and outputs by employment level
16 Studies in Human Society – Distribution of researchers and outputs by employment level
17 Psychology and Cognitive Sciences – Distribution of researchers and outputs by employment level
18 Law – Distribution of researchers and outputs by employment level
19 Studies in Creative Arts and Writing – Distribution of researchers and outputs by employment level
20 Language, Communication and Culture – Distribution of researchers and outputs by employment level
21 History and Archaeology – Distribution of researchers and outputs by employment level
22 Philosophy and Religious Studies – Distribution of researchers and outputs by employment level